
What judgment does this research establish, and what evidence would invalidate it?
Introduction: A stronger total does not finish the analysis
An improvement in aggregate exports is often treated as shorthand for stronger external demand, healthier export orders and better corporate cash flow. That shortcut compresses several different events into one number. Goods may be shipped in greater quantities, or the mix may shift toward higher-value products. Reported destinations may broaden because of processing, assembly or inventory movements rather than stronger final consumption. Even when goods are delivered and revenue is recognized, the company may still be waiting for payment.
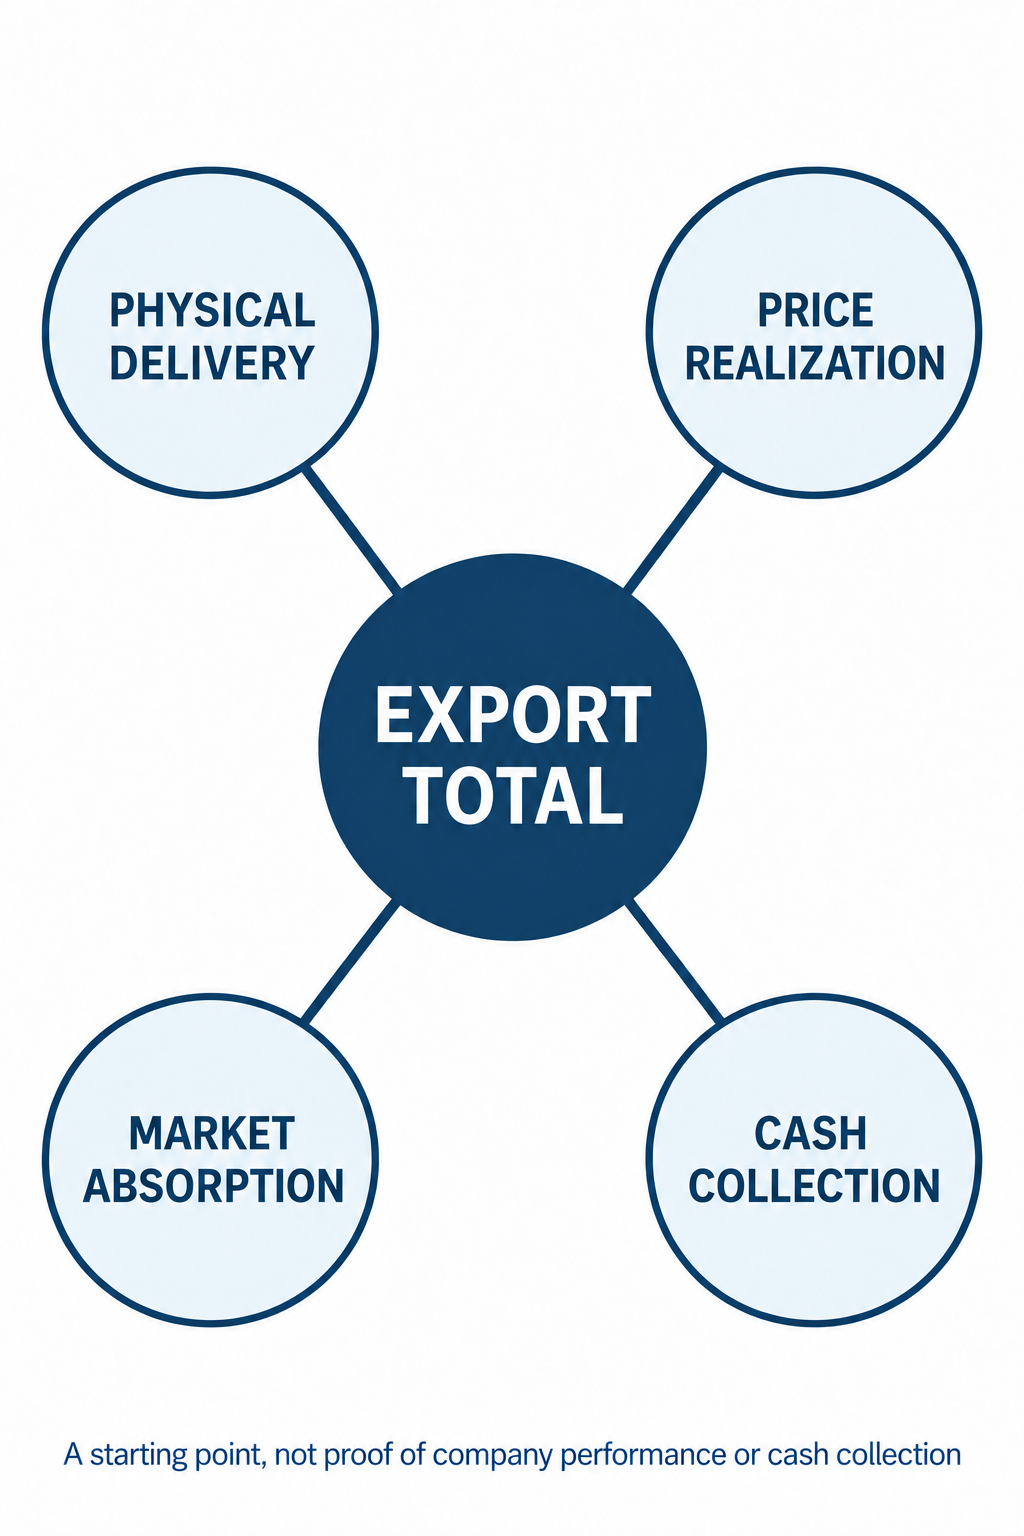
This article proposes a four-layer framework for studying export-chain resilience: volume, price, destination and cash collection. The first two layers examine physical delivery and value realization. The third examines whether new markets represent durable demand and meaningful diversification. The fourth tests whether industry-level signals are actually converted into company revenue and cash.
The available public evidence supports this framework, but it does not support a definitive judgment on August 2026 detailed exports or on any particular company. The point is therefore methodological and analytical: an export total can identify a direction for research, but it cannot substitute for company-level verification.
1. What export-chain resilience should mean
Export-chain resilience should be defined as the ability of physical deliveries, price realization, market absorption and cash collection to remain sustainable when external conditions change. It is not identical to export value, and it cannot be inferred from a single monthly change.
The same aggregate outcome can be generated by very different combinations. Higher volume with stable comparable unit values may be consistent with more deliveries. Stable volume with a higher average unit value may reflect product upgrading, a change in destination mix or a greater share of high-value goods. Lower volume with a higher average value may indicate that low-value products have exited the mix rather than that pricing power has improved. Each pattern implies a different explanation for demand, operating performance and eventual cash conversion.
The total is therefore best treated as a question generator. It can tell a researcher where to look next: at product categories, quantities, unit values, destinations and company disclosures. It cannot, by itself, establish stable orders, higher margins or sufficient cash.
2. Volume: did comparable reported export quantity increase?
The volume question starts with whether comparable reported export quantity increased. Customs quantity alone cannot prove that overseas customers received the goods; actual receipt still requires independent logistics, acceptance or company-disclosure evidence. The answer is meaningful only when the product definition, measurement unit and comparison period are consistent. Weight, pieces and units cannot be casually combined. Even a common unit may be misleading when product specifications change, because the number of items may no longer represent the same functional capacity.
A one-month increase is also compatible with several temporary explanations. Exporters may have fulfilled backlogged orders, customers may have pulled purchases forward, or holidays may have shifted shipment timing. A policy deadline can create a delivery window without creating durable demand. The appropriate response is to examine subsequent months and a longer time series, while checking whether the movement is broad across important products.
If volume rises and then quickly falls, the interpretation of sustained demand expansion should be weakened. If the increase is concentrated before a policy change, it may be timing rather than resilience. Stronger evidence would require comparable products to improve over consecutive periods without a clear pull-forward explanation.
Industry volume is not automatically company demand. The company’s actual products must map reasonably well to the statistical categories. Where product boundaries, specifications or selling entities differ, industry volume remains background context rather than direct evidence of a company’s order book.
3. Price: statistical unit value is not a quotation
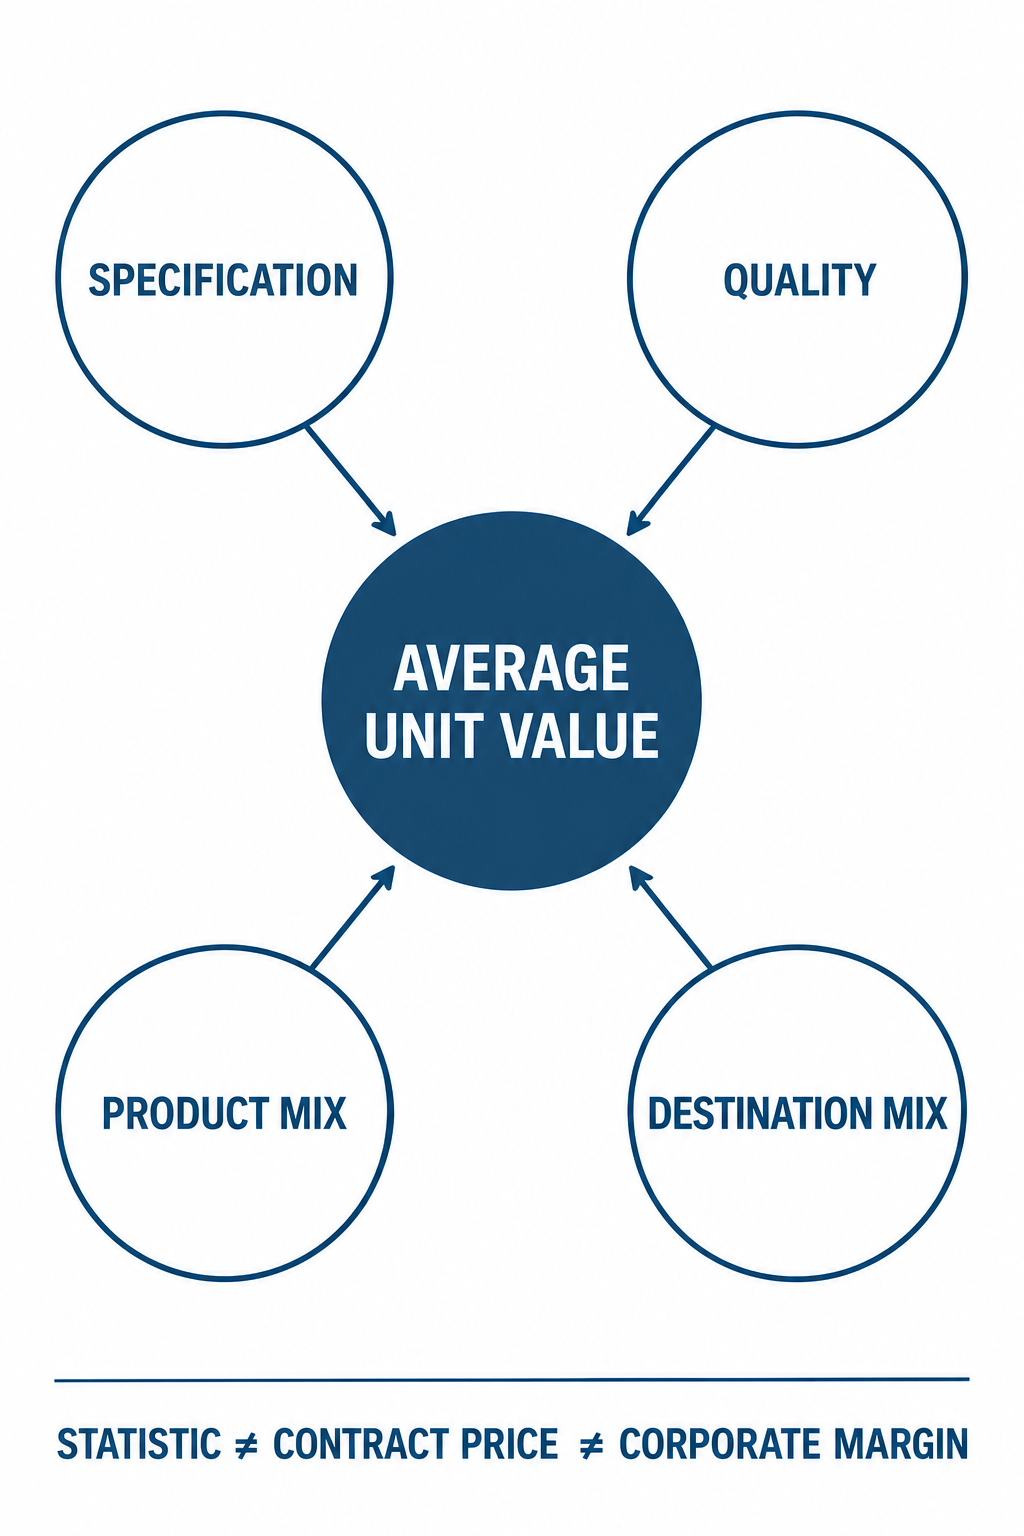
Under a consistent product scope, unit and currency basis, export value can be decomposed approximately into quantity multiplied by average unit value. But an average unit value is not the contract price of a standardized product. It incorporates product specifications, quality, brand, product mix and destination mix.
A larger share of high-specification goods can lift the average unit value even if the contract price of each individual product has not increased. Conversely, a larger share of lower-value goods can reduce the average without proving that every exporter has lost pricing power. The unit value is therefore a statistical observation that requires explanation, not a completed price conclusion.
A more credible price analysis compares detailed products with stable specifications in the same destination where possible. If an apparent improvement disappears after holding the mix constant, the primary explanation should shift toward composition. If volume and unit value move in opposite directions, the analyst should distinguish mix changes from competitive pricing and product upgrading.
Industry unit value cannot replace a company’s product pricing or margin disclosure. Corporate profitability also depends on raw materials, labor, freight, foreign-exchange movements, expenses, customer mix and other operating factors. Without company-specific disclosures, a higher industry unit value does not establish higher gross margin, earnings or valuation.
4. Read volume and price together
Looking at volume or price in isolation encourages selective interpretation. The combination provides a more disciplined set of hypotheses:
- Higher volume and stable comparable unit value are more consistent with delivery expansion, although pull-forward shipments still need to be excluded.
- Higher volume and lower unit value may reflect a mix shift toward lower-value products, stronger competition or both.
- Lower volume and higher unit value may reflect product upgrading, or the exit of low-value products.
- Lower volume and lower unit value are a more direct warning for the relevant product group, but seasonality and statistical boundaries still need to be checked.
These patterns are hypotheses, not automatic industry conclusions. An explanation that cannot account for major products, major destinations and consecutive periods should not be elevated into a claim of broad export-chain strengthening or deterioration.
The current evidence provides the logic for this decomposition but not the complete numerical series needed to classify China’s latest exports into one of these patterns. It is important to preserve that distinction: a framework can be well supported even when the latest measurement remains incomplete.
5. More destinations do not automatically mean less concentration risk
The destination layer asks which markets absorbed new deliveries and whether that absorption genuinely reduced dependence. Counting new countries or regions is insufficient. The analysis should also examine the share of major destinations, the concentration of incremental growth and whether new markets are exposed to the same demand or policy driver as the old ones.
Several destinations can grow at once while the underlying risk remains concentrated. New growth may be limited to a narrow product group, a common industrial chain or a demand cycle that affects all of the destinations together. Geographic breadth is not the same as economic independence.
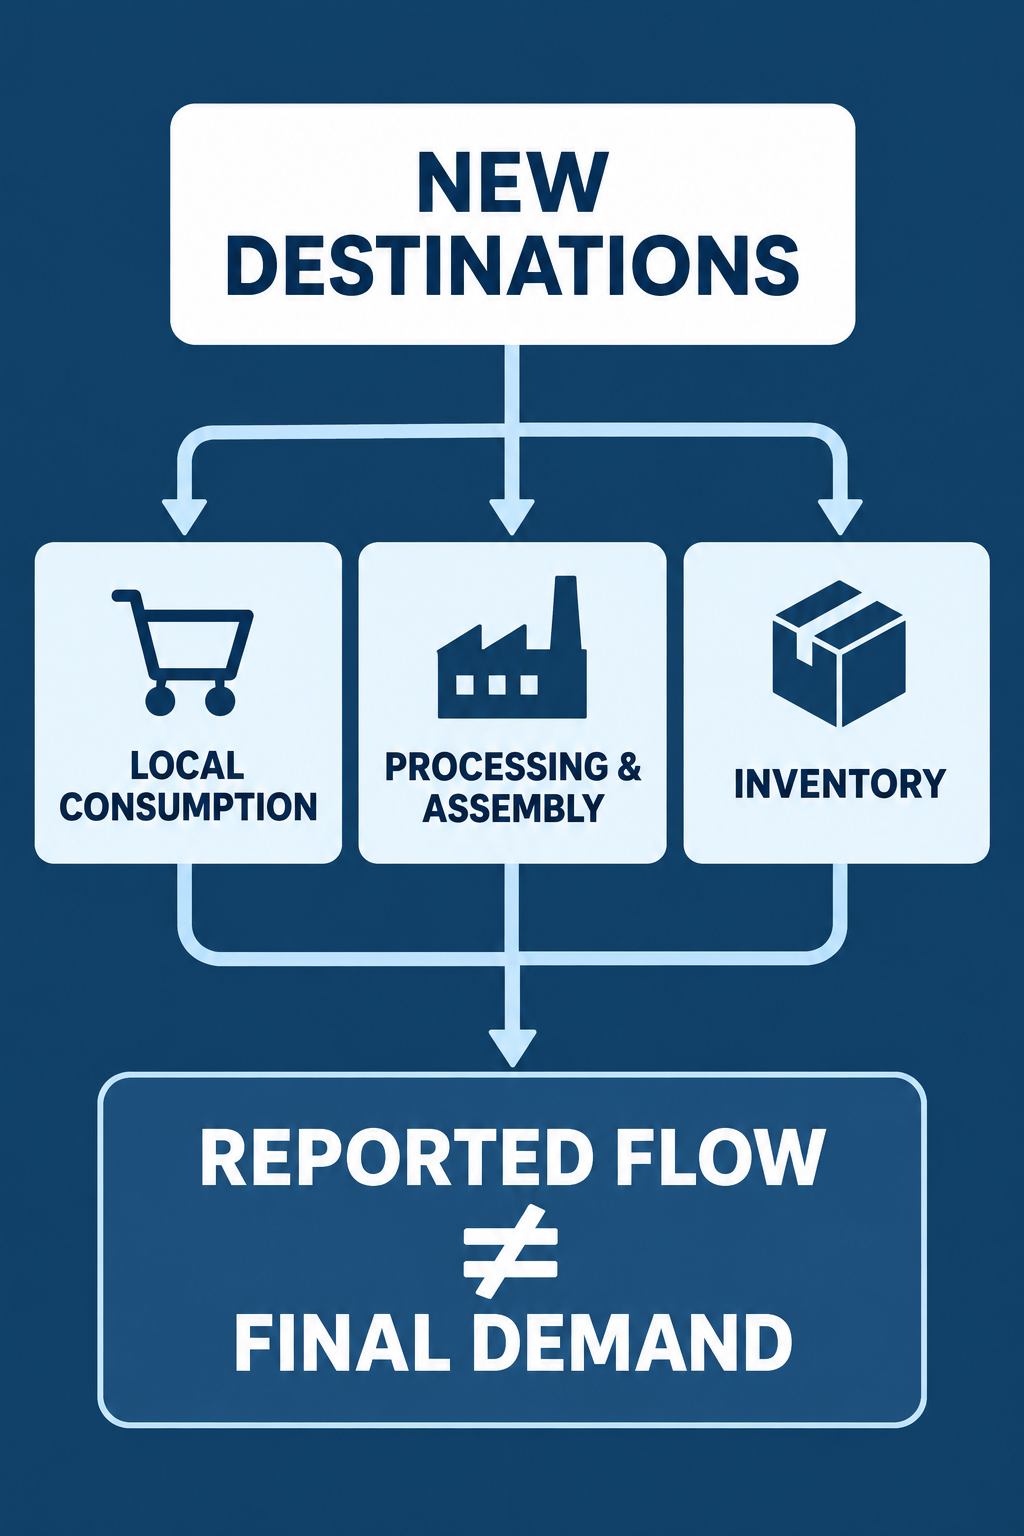
Trade diversion also needs to be separated into at least three mechanisms: a change in delivery destination, a relocation of production stages, and a change in final demand. An increase in imports from China by one destination may reflect local consumption, processing, assembly or inventory accumulation. These mechanisms have different implications for Chinese exporters.
Customs destination data can identify the reported flow, but it cannot alone establish where final consumption occurred or prove that a particular trade arrangement has been created. A durable interpretation requires independent evidence on import composition, local production, local demand and applicable rules. If destination growth is not accompanied by relevant demand, or is followed by inventory correction, the persistence of the flow must be reconsidered.
For a company, industry-level destination expansion can be relevant only when the company has actual customers, product access and delivery capability in those markets. A broader map is not the same as an order that the company can capture.
6. AI-related goods: a positive signal that still needs boundaries
The World Trade Organization’s March 2026 trade outlook identifies trade diversion and AI-related goods as contributors to trade performance. This is an important research signal, but it cannot be converted directly into the operating contribution of Chinese exporters.
The first requirement is to understand the WTO’s definition of AI-related goods and then identify a verifiable correspondence with customs classifications. If a small number of technology-related categories account for a meaningful share of the improvement, aggregate trade can look strong while traditional consumer goods, general equipment and other categories move differently.
The countertest is essential. If non-AI-related goods also show broad and continuous volume improvement after the relevant categories are separated, the coverage of resilience is stronger. If the improvement is concentrated in a few categories, the supported conclusion is only that the export structure contains areas of strength. It is not evidence that all exporters benefit.
An AI-related term in a company name, product description or marketing statement is not proof that the company has captured the relevant demand. Global trade contribution cannot be mechanically translated into a company’s revenue, earnings or cash contribution. Product definitions, company product boundaries and revenue-recognition policies must be matched.
7. Cash collection: the final test of corporate conversion
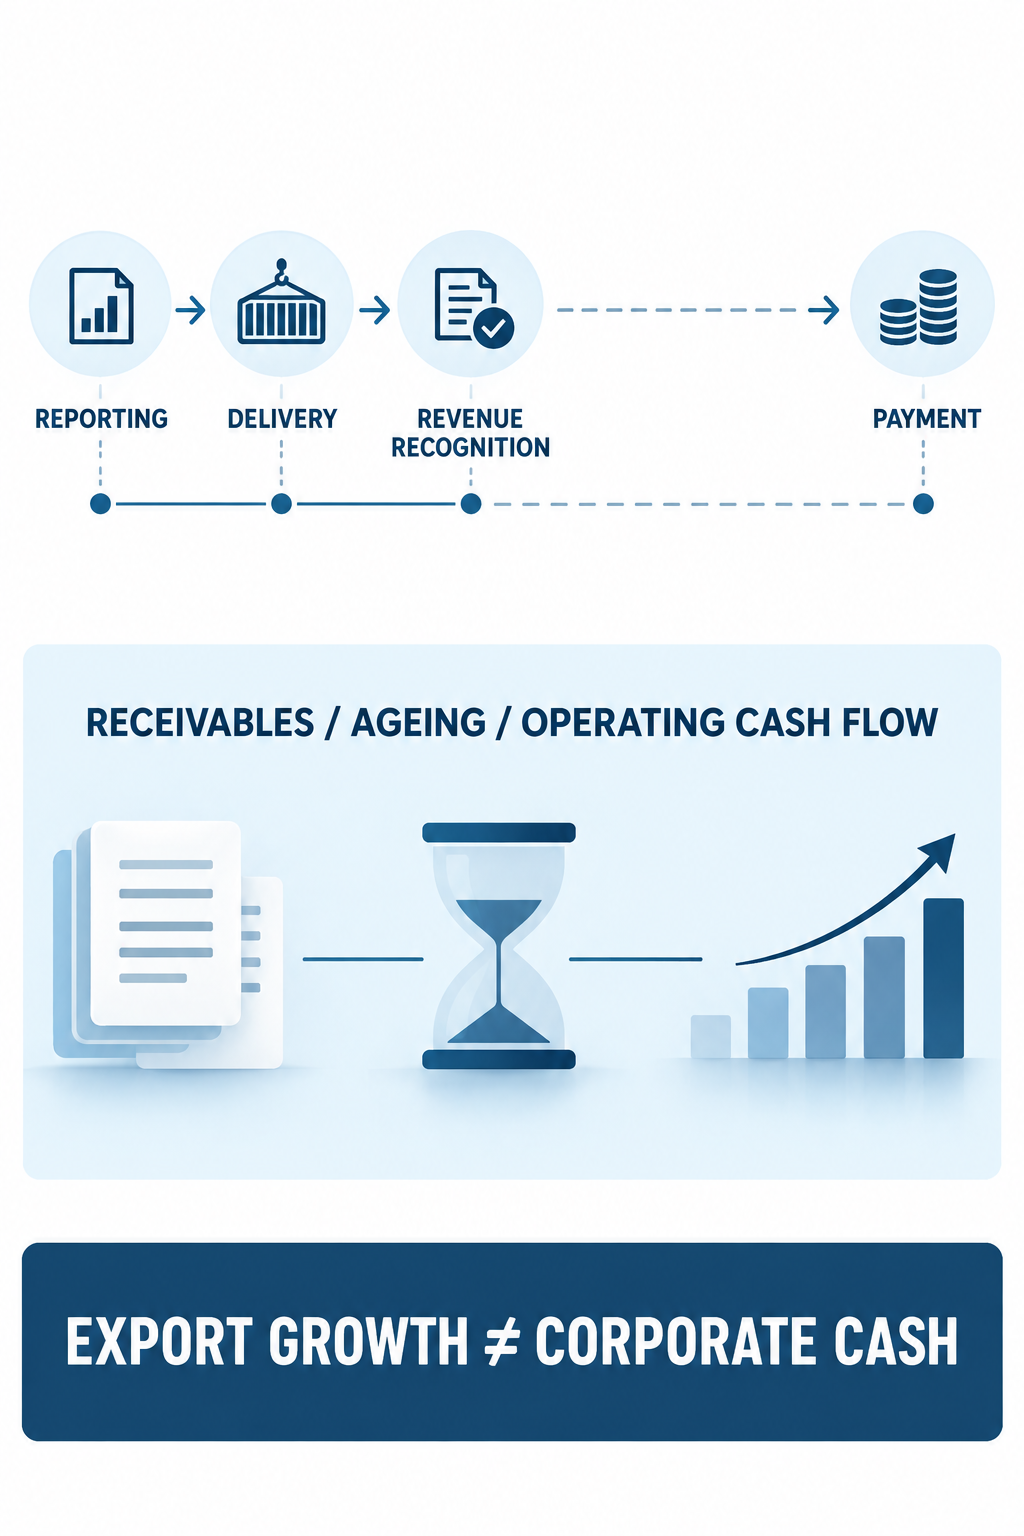
Cash collection is the critical bridge between industry conditions and company operating performance and cash realization. Customs export value follows a reporting and shipment framework. Reporting, shipment, delivery, revenue recognition and payment can occur at different times, and overseas sales may be executed through different entities or settlement arrangements.
For a specific company, the relevant public disclosures include the scope of overseas revenue, revenue-recognition policies, changes in receivables, ageing, impairment, operating cash flow and settlement terms. These are verification requirements, not observations about a particular company in the current evidence set.
Cash analysis should not be reduced to one ratio. Receivables are a point-in-time balance, while revenue is measured over a period. Seasonality and settlement timing affect their relationship. Operating cash flow is also influenced by inventory, payables, taxes and other operating items. A single-period increase in receivables does not automatically prove deteriorating customer quality, and a single-period cash-flow improvement does not automatically represent better export collections.
A stronger interpretation connects revenue, receivables, ageing and cash flow across consecutive periods. It distinguishes normal working-capital investment caused by business expansion from pressure caused by longer payment terms. If revenue rises while receivables expand, ageing lengthens and cash conversion weakens, export totals should not be used to claim smooth cash collection. If cash improves mainly because of inventory, payables or other operating changes, the improvement cannot be attributed entirely to customer payments.
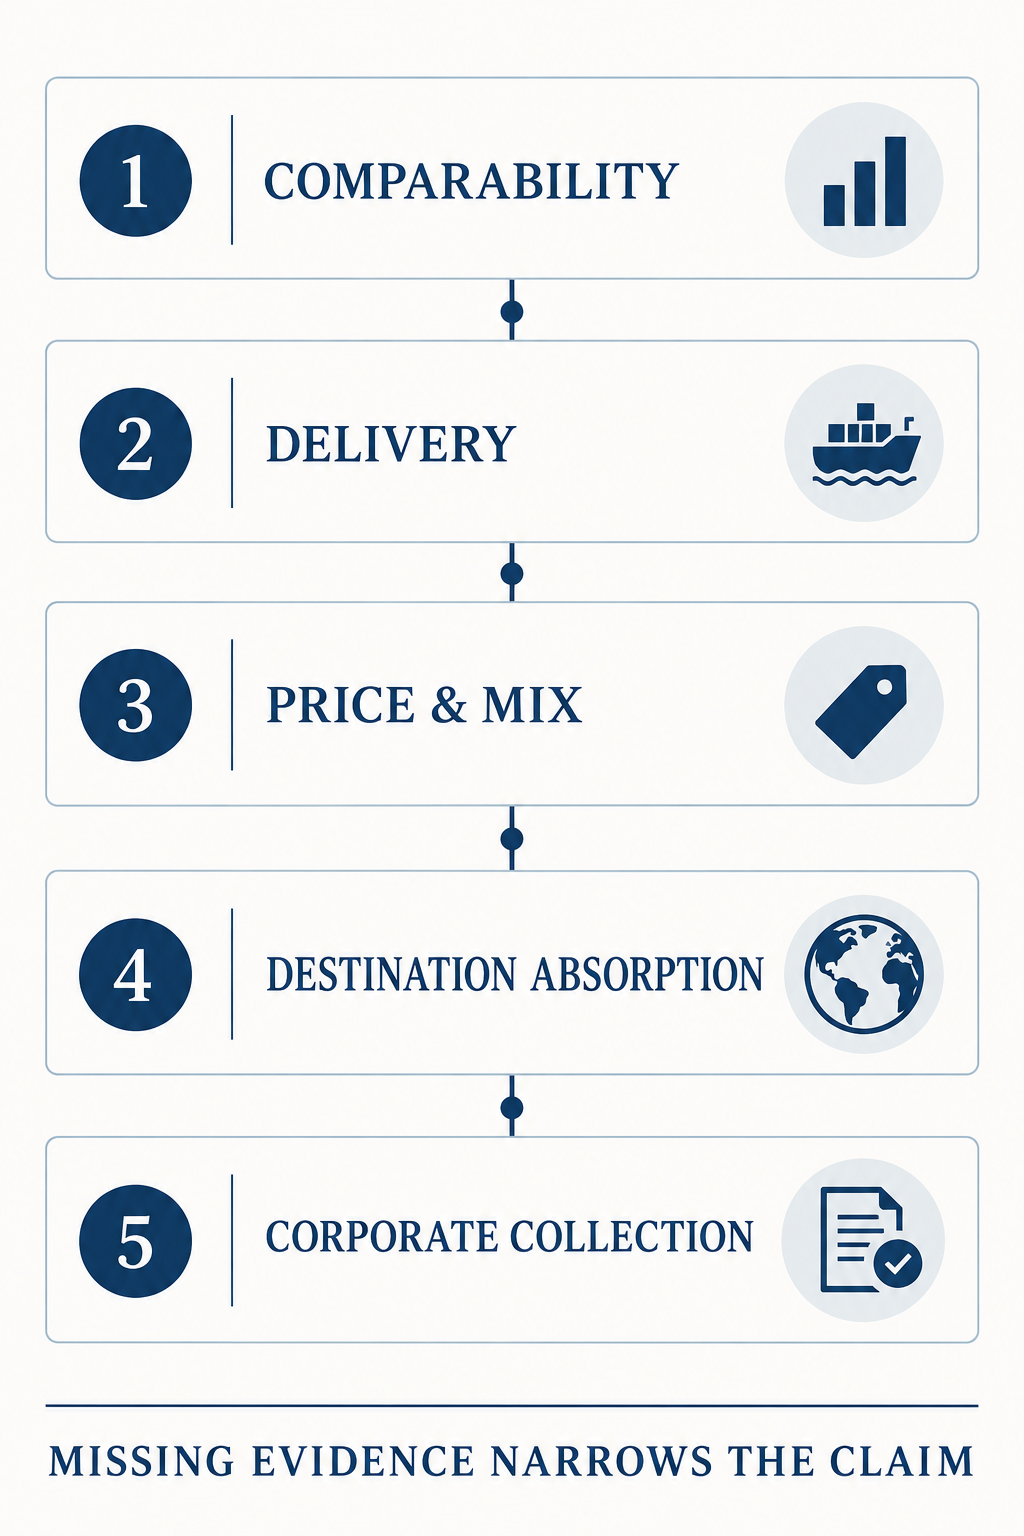
8. Five gates for moving from macro data to a company view
A practical review can be organized into five gates.
The first is statistical comparability: are product scope, measurement unit, currency and periods consistent? Without this gate, volume and price decomposition is unstable.
The second gate separates reported quantity from verified delivery: are important product groups improving across comparable periods, are pull-forward reporting, backlog effects and seasonality excluded, and do independent logistics, acceptance or company disclosures support actual customer receipt? Quantity alone supports only a reported-volume observation.
The third is price and mix: does the unit-value change persist within stable products and destinations, or is it driven by composition? Passing this gate still does not establish a higher corporate margin.
The fourth is destination absorption: does the new market show final-demand support and lower concentration, or is the reported flow mainly processing, assembly or inventory? Passing this gate supports a stronger market-absorption interpretation only within the evidence available.
The fifth is company operating performance and cash collection: do the company, product and geographic boundaries match the industry data, and is revenue converted into verifiable collection? Without this gate, the conclusion should remain at the level of industry context or reported revenue.
The gates are not a mechanical score. They are a safeguard against allowing one positive signal to cover another missing layer. Better reported volume with unclear pricing or independent delivery evidence supports only a reported-volume observation. More destinations with uncertain final demand support only a broader reported flow. Higher revenue without collection evidence supports only a limited revenue statement.
9. Counterexamples that can make a positive signal misleading
A higher total concentrated in a few high-value products may coexist with weak volumes across most relevant products. A temporary volume increase may reflect backlog delivery or customer pre-stocking. More destinations may reflect processing or inventory rather than diversified final consumption. Revenue growth may occur alongside lengthening receivable ageing and weaker cash conversion. Operating cash flow may improve because of payables or inventory movements rather than export collections.
These counterexamples do not make positive data useless. They determine how narrowly the conclusion must be written. Customs data can identify a research direction; company disclosures are needed to test company operating performance and cash collection. Neither should be used to erase the boundary between reported flow, delivery, recognized revenue and cash received.
10. What the current evidence supports
The public first-party materials in scope are a General Administration of Customs statistical portal, a 2025 full-year US-dollar value table from the customs authority, and the WTO trade outlook published in March 2026. The customs portal provides an entry point to total, country and commodity quantity-value tables. The WTO material provides research signals concerning trade diversion and AI-related goods.
A further limitation is institutional independence: these three materials come from only two independent primary institutions—the General Administration of Customs and the World Trade Organization. They therefore do not satisfy a three-independent-primary-source evidence target.
This evidence is sufficient to support the analytical framework and the claim that export totals cannot substitute for company operating performance and cash realization. It is not sufficient to provide a reproducible detailed August 2026 decomposition, a complete quantity and unit-value time series, the full definition and scale of AI-related goods, independent evidence of final demand in new destinations, or company-specific collection disclosures.
Accordingly, this article does not insert amounts, growth rates or corporate cash figures that are absent from the evidence. It also does not claim that the listed verification steps have already been completed. The supported conclusion is narrower and more useful: export resilience must be tested layer by layer, and each stronger company conclusion requires new, matched evidence.
11. A record template for the next case
For a particular industry or company, record the following before strengthening the conclusion:
Research subject: Product classification and statistical scope: Comparison period: Quantity and measurement unit: Average unit value and calculation basis: Major destinations and concentration: Evidence for final demand in new destinations: Company overseas-revenue scope: Receivables and ageing evidence: Operating-cash-flow evidence: Primary sources supporting the conclusion: Counterevidence: Current judgment: Key unknowns: Conditions that would invalidate the judgment:
This template is not an audit and not an investment recommendation. Its purpose is to make the boundary between fact, inference, hypothesis and unknown explicit. It also prevents an industry statistic from being combined with a company disclosure before product, entity and geographic scopes have been reconciled.
Primary-source links:
- General Administration of Customs statistical portal: https://english.customs.gov.cn/Statistics/Statistics?ColumnId=1
- General Administration of Customs 2025 full-year US-dollar value table: https://english.customs.gov.cn/Statics/4733ad72-5ba7-4b60-bfbd-00e2f4eef77f.html
- WTO Global Trade Outlook and Statistics, March 2026: https://www.wto.org/english/res_e/booksp_e/gtos0326_e.pdf
Conclusion: resilience is an evidence chain
China’s export-chain resilience cannot be answered by the export total alone. A more reliable sequence is to verify comparable physical delivery, explain the product and pricing mechanism behind unit values, test whether destination changes represent durable final demand, and then examine whether company revenue is converted into verifiable collection.
When the layers reinforce one another, the conclusion can become stronger. When any layer produces contrary evidence, the conclusion should become narrower. The available public materials establish a useful method and clear boundaries, but they do not establish a definitive view of the latest month or any specific company.
The practical question for an investment researcher is therefore not simply, “How much did exports grow?” It is, “Which layer improved, can it persist, can it reach the company under review, and can the final step be confirmed in cash evidence?” Until those questions are answered, the aggregate total remains a starting point—not a substitute for company operating performance and cash collection.
Apply the five-gate framework to your next export-industry or company case, and record the supporting evidence, counterevidence, unknowns and invalidation conditions.
This article relies on a public customs statistical portal, a 2025 full-year US-dollar value table from the customs authority, and a WTO trade outlook published in March 2026. The available evidence does not provide a reproducible detailed August 2026 decomposition, a complete volume and unit-value series, the full mapping and scale of AI-related goods, independent final-demand evidence for new destinations, or company-specific collection disclosures. Customs unit value is not a product quotation, and export value is not company revenue or cash flow. This is research analysis, not a recommendation on an individual security or transaction.
A further limitation is institutional independence: these three materials come from only two independent primary institutions—the General Administration of Customs and the World Trade Organization. They therefore do not satisfy a three-independent-primary-source evidence target.